


chiffres clés
Ouverture :
18.580 €
Perf Ouverture :
-0.54 %
+ Haut :
18.580 €
+ Bas :
18.250 €
Clôture veille :
18.600 €
Volume :
718 832
Capi échangé :
+0.13 %
Capi :
10 164 M€
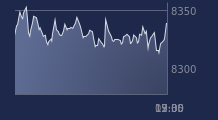
Graphique GETLINK SE sur 5 jours
Cours GETLINK SE sur 5 jours
| 06/07 | 07/07 | 08/07 | 09/07 | 10/07 | Date |
|---|---|---|---|---|---|
| 18.570(c) | 18.590(c) | 18.410(c) | 18.600(c) | 18.480(c) | Dernier |
| -0.85 % | +0.11 % | -0.97 % | +1.03 % | -0.65 % | Var. |
| 594 131 | 471 177 | 1 408 110 | 704 742 | 718 832 | Volume |
| 18.810 | 18.540 | 18.610 | 18.470 | 18.580 | Ouv. |
| 18.810 | 18.730 | 18.610 | 18.600 | 18.580 | + Haut |
| 18.490 | 18.530 | 18.250 | 18.310 | 18.250 | + Bas |
| 18.557 | 18.574 | 18.576 | 18.589 | 18.592 | MM20 |
| 18.598 | 18.587 | 18.572 | 18.569 | 18.557 | MM50 |
| 18.473 | 18.482 | 18.489 | 18.495 | 18.498 | MM100 |
Performances historiques GETLINK SE
| 5 jours | 1 mois | 1er janvier | 5 ans |
|---|---|---|---|
| -1.33 % | +1.32 % | +17.48 % | +33.33 % |
Court terme
Neutre
Moyen terme
Neutre
Long terme
Neutre
Portefeuille Trading
+319.20 % vs +67.75 % pour le CAC 40
Performance depuis le 28 mai 2008