chiffres clés
Ouverture :
16.440 €
Perf Ouverture :
-0.12 %
+ Haut :
16.460 €
+ Bas :
16.300 €
Clôture veille :
16.420 €
Volume :
43 389
Capi échangé :
+0.03 %
Capi :
2 302 M€
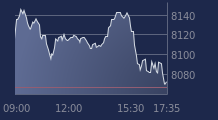
Graphique CARMILA sur 5 jours
Cours CARMILA sur 5 jours
| 26/01 | 27/01 | 28/01 | 29/01 | 30/01 | Date |
|---|---|---|---|---|---|
| 16.300(c) | 16.240(c) | 16.420(c) | 16.420(c) | - | Dernier |
| +0.12 % | -0.37 % | +1.11 % | 0.00 % | - | Var. |
| 33 156 | 134 657 | 48 952 | 43 389 | - | Volume |
| 16.340 | 16.340 | 16.240 | 16.440 | - | Ouv. |
| 16.380 | 16.340 | 16.460 | 16.460 | - | + Haut |
| 16.220 | 16.160 | 16.200 | 16.300 | - | + Bas |
| 16.544 | 16.514 | 16.488 | 16.459 | - | MM20 |
| 16.650 | 16.637 | 16.635 | 16.632 | - | MM50 |
| 16.780 | 16.774 | 16.769 | 16.764 | - | MM100 |
Performances historiques CARMILA
| 5 jours | 1 mois | 1er janvier | 5 ans |
|---|---|---|---|
| +0.12 % | -2.38 % | -3.41 % | +46.87 % |
Court terme
Neutre
Moyen terme
Baissière
Long terme
Baissière
Portefeuille Trading
+338.80 % vs +62.37 % pour le CAC 40
Performance depuis le 28 mai 2008


