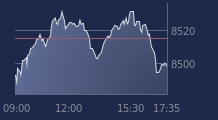
chiffres clés
Ouverture :
51.300 €
Perf Ouverture :
+0.12 %
+ Haut :
51.600 €
+ Bas :
51.100 €
Clôture veille :
51.240 €
Volume :
429 172
Capi échangé :
+0.11 %
Capi :
19 790 M€
Graphique BOUYGUES sur 5 jours
Cours BOUYGUES sur 5 jours
| 17/02 | 18/02 | 19/02 | 20/02 | 23/02 | Date |
|---|---|---|---|---|---|
| 49.960(c) | 50.440(c) | 50.940(c) | 51.240(c) | 51.360 | Dernier |
| -0.52 % | +0.96 % | +0.99 % | +0.59 % | +0.23 % | Var. |
| 451 353 | 488 153 | 524 037 | 731 964 | 429 172 | Volume |
| 50.220 | 50.380 | 50.200 | 51.000 | 51.300 | Ouv. |
| 50.420 | 50.740 | 51.020 | 51.620 | 51.600 | + Haut |
| 49.580 | 49.990 | 50.080 | 50.740 | 51.100 | + Bas |
| 47.098 | 47.410 | 47.693 | 48.030 | 48.368 | MM20 |
| 45.588 | 45.733 | 45.878 | 46.029 | 46.193 | MM50 |
| 43.023 | 43.145 | 43.272 | 43.401 | 43.531 | MM100 |
Performances historiques BOUYGUES
| 5 jours | 1 mois | 1er janvier | 5 ans |
|---|---|---|---|
| +2.27 % | +13.43 % | +15.81 % | +54.75 % |
Court terme
Haussière
Moyen terme
Haussière
Long terme
Haussière
Portefeuille Trading
+335.80 % vs +70.93 % pour le CAC 40
Performance depuis le 28 mai 2008


