


chiffres clés
Ouverture :
6.690 €
Perf Ouverture :
-1.42 %
+ Haut :
6.815 €
+ Bas :
6.565 €
Clôture veille :
6.665 €
Volume :
90 522
Capi échangé :
+0.11 %
Capi :
546 M€
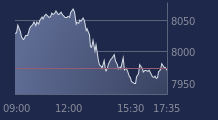
Graphique BENETEAU sur 5 jours
Cours BENETEAU sur 5 jours
| 12/03 | 13/03 | 16/03 | 17/03 | 18/03 | Date |
|---|---|---|---|---|---|
| 6.790(c) | 6.680(c) | 6.550(c) | 6.665(c) | 6.595(c) | Dernier |
| -2.51 % | -1.62 % | -1.95 % | +1.76 % | -1.05 % | Var. |
| 75 138 | 82 412 | 43 659 | 72 919 | 90 522 | Volume |
| 6.960 | 6.800 | 6.650 | 6.565 | 6.690 | Ouv. |
| 6.960 | 6.800 | 6.650 | 6.750 | 6.815 | + Haut |
| 6.745 | 6.620 | 6.510 | 6.510 | 6.565 | + Bas |
| 7.462 | 7.412 | 7.355 | 7.307 | 7.249 | MM20 |
| 7.879 | 7.847 | 7.810 | 7.774 | 7.737 | MM50 |
| 7.999 | 7.981 | 7.963 | 7.945 | 7.927 | MM100 |
Performances historiques BENETEAU
| 5 jours | 1 mois | 1er janvier | 5 ans |
|---|---|---|---|
| -5.31 % | -13.56 % | -20.59 % | -48.48 % |
Court terme
Baissière
Moyen terme
Baissière
Long terme
Baissière
Pas de conseil sur cette valeur
Portefeuille Trading
+336.50 % vs +60.32 % pour le CAC 40
Performance depuis le 28 mai 2008