


chiffres clés
Ouverture :
69.900 €
Perf Ouverture :
-0.14 %
+ Haut :
70.200 €
+ Bas :
69.300 €
Clôture veille :
69.700 €
Volume :
17 220
Capi échangé :
+0.07 %
Capi :
1 799 M€
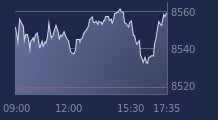
Graphique ARGAN sur 5 jours
Cours ARGAN sur 5 jours
| 20/02 | 23/02 | 24/02 | 25/02 | 26/02 | Date |
|---|---|---|---|---|---|
| 69.700(c) | 69.400(c) | 69.700(c) | 69.800(c) | - | Dernier |
| +1.46 % | -0.43 % | +0.43 % | +0.14 % | - | Var. |
| 15 582 | 16 714 | 12 889 | 17 220 | - | Volume |
| 68.900 | 69.800 | 69.400 | 69.900 | - | Ouv. |
| 70.000 | 69.800 | 70.200 | 70.200 | - | + Haut |
| 68.600 | 69.200 | 69.200 | 69.300 | - | + Bas |
| 66.515 | 66.735 | 66.950 | 67.135 | - | MM20 |
| 65.742 | 65.876 | 66.018 | 66.158 | - | MM50 |
| 65.834 | 65.892 | 65.947 | 66.000 | - | MM100 |
Performances historiques ARGAN
| 5 jours | 1 mois | 1er janvier | 5 ans |
|---|---|---|---|
| +2.80 % | +7.06 % | +5.76 % | -19.21 % |
Court terme
Haussière
Moyen terme
Haussière
Long terme
Haussière
Portefeuille Trading
+335.70 % vs +72.18 % pour le CAC 40
Performance depuis le 28 mai 2008