


chiffres clés
Ouverture :
117.400 €
Perf Ouverture :
0.00 %
+ Haut :
118.000 €
+ Bas :
116.800 €
Clôture veille :
117.400 €
Volume :
8 343
Capi échangé :
+0.04 %
Capi :
2 744 M€
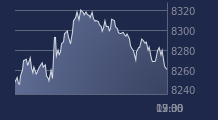
Graphique ALTAREA sur 5 jours
Cours ALTAREA sur 5 jours
| 07/04 | 08/04 | 09/04 | 10/04 | 13/04 | Date |
|---|---|---|---|---|---|
| 113.800(c) | 120.200(c) | 117.400(c) | 117.400(c) | - | Dernier |
| -1.73 % | +5.62 % | -2.33 % | 0.00 % | - | Var. |
| 8 220 | 15 443 | 7 994 | 8 343 | - | Volume |
| 117.400 | 117.800 | 120.200 | 117.400 | - | Ouv. |
| 117.400 | 120.400 | 120.200 | 118.000 | - | + Haut |
| 113.800 | 117.600 | 115.800 | 116.800 | - | + Bas |
| 114.310 | 114.600 | 114.560 | 114.600 | - | MM20 |
| 117.728 | 117.892 | 117.976 | 118.036 | - | MM50 |
| 112.282 | 112.476 | 112.642 | 112.817 | - | MM100 |
Performances historiques ALTAREA
| 5 jours | 1 mois | 1er janvier | 5 ans |
|---|---|---|---|
| +1.38 % | +2.62 % | +7.12 % | -26.44 % |
Court terme
Haussière
Moyen terme
Haussière
Long terme
Haussière
Portefeuille Trading
+332.70 % vs +66.15 % pour le CAC 40
Performance depuis le 28 mai 2008