


chiffres clés
Ouverture :
63.960 €
Perf Ouverture :
+0.75 %
+ Haut :
64.780 €
+ Bas :
63.760 €
Clôture veille :
63.660 €
Volume :
1 807 900
Capi échangé :
+0.10 %
Capi :
115 812 M€
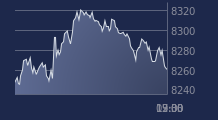
Graphique AB INBEV sur 5 jours
Cours AB INBEV sur 5 jours
| 02/04 | 07/04 | 08/04 | 09/04 | 10/04 | Date |
|---|---|---|---|---|---|
| 61.500(c) | 61.620(c) | 63.600(c) | 63.660(c) | 64.440(c) | Dernier |
| +1.25 % | +0.20 % | +3.21 % | +0.09 % | +1.23 % | Var. |
| 2 022 950 | 2 181 930 | 2 783 380 | 2 188 910 | 1 807 900 | Volume |
| 60.900 | 62.340 | 63.000 | 63.900 | 63.960 | Ouv. |
| 61.880 | 62.800 | 64.060 | 63.900 | 64.780 | + Haut |
| 60.780 | 61.460 | 62.760 | 62.520 | 63.760 | + Bas |
| 61.217 | 61.141 | 61.192 | 61.209 | 61.297 | MM20 |
| 63.186 | 63.240 | 63.332 | 63.429 | 63.544 | MM50 |
| 59.078 | 59.136 | 59.210 | 59.290 | 59.387 | MM100 |
Performances historiques AB INBEV
| 5 jours | 1 mois | 1er janvier | 5 ans |
|---|---|---|---|
| +4.78 % | +2.97 % | +17.38 % | +17.53 % |
Court terme
Haussière
Moyen terme
Haussière
Long terme
Haussière
Portefeuille Trading
+332.70 % vs +66.15 % pour le CAC 40
Performance depuis le 28 mai 2008