Ouverture :
16.910 €
Perf Ouverture :
-0.03 %
+ Haut :
17.170 €
+ Bas :
16.530 €
Clôture veille :
16.575 €
Volume :
935 686
Capi échangé :
+0.40 %
Capi :
3 962 M€
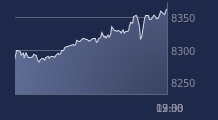
Graphique VALLOUREC sur 5 jours
Cours VALLOUREC sur 5 jours
| 06/01 | 07/01 | 08/01 | 09/01 | 09/01 | Date |
|---|---|---|---|---|---|
| 16.375 | 15.82 | 16.575 | 16.905 | 16.905 | Dernier |
| +0.71 % | -3.39 % | +4.77 % | +1.99 % | +1.99 % | Var. |
| 527988 | 676010 | 1141290 | 935686 | 935686 | Volume |
| 16.45 | 16.375 | 16.02 | 16.91 | 16.91 | Ouv. |
| 16.69 | 16.385 | 16.69 | 17.17 | 17.17 | + Haut |
| 16.25 | 15.735 | 15.915 | 16.53 | 16.53 | + Bas |
| 15.6805 | 15.6812 | 15.7308 | 15.8 | 15.8 | MM20 |
| 15.8748 | 15.8782 | 15.8956 | 15.9181 | 15.9181 | MM50 |
| 15.8305 | 15.8309 | 15.8399 | 15.8507 | 15.8507 | MM100 |
Performances historiques VALLOUREC
| 5 jours | 1 mois | 1er janvier | 5 ans |
|---|---|---|---|
| +5.66 % | +8.47 % | +7.74 % | +59.89 % |
Court terme
Haussière
Moyen terme
Haussière
Long terme
Haussière
Portefeuille Trading
+335.10 % vs +68.21 % pour le CAC 40
Performance depuis le 28 mai 2008


