


chiffres clés
Ouverture :
31.460 €
Perf Ouverture :
-0.32 %
+ Haut :
31.700 €
+ Bas :
31.340 €
Clôture veille :
31.520 €
Volume :
60 726
Capi échangé :
+0.06 %
Capi :
3 243 M€
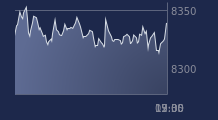
Graphique RUBIS sur 5 jours
Cours RUBIS sur 5 jours
| 06/07 | 07/07 | 08/07 | 09/07 | 10/07 | Date |
|---|---|---|---|---|---|
| 31.280(c) | 31.000(c) | 31.360(c) | 31.520(c) | 31.360(c) | Dernier |
| -1.39 % | -0.90 % | +1.16 % | +0.51 % | -0.51 % | Var. |
| 115 993 | 171 028 | 191 118 | 117 277 | 60 726 | Volume |
| 31.700 | 31.200 | 31.000 | 31.320 | 31.460 | Ouv. |
| 31.840 | 31.580 | 31.360 | 31.620 | 31.700 | + Haut |
| 31.000 | 31.000 | 30.980 | 31.120 | 31.340 | + Bas |
| 32.922 | 32.705 | 32.492 | 32.270 | 32.041 | MM20 |
| 34.391 | 34.331 | 34.270 | 34.206 | 34.131 | MM50 |
| 34.534 | 34.496 | 34.462 | 34.429 | 34.394 | MM100 |
Performances historiques RUBIS
| 5 jours | 1 mois | 1er janvier | 5 ans |
|---|---|---|---|
| -1.13 % | -11.26 % | -2.18 % | -13.23 % |
Court terme
Baissière
Moyen terme
Baissière
Long terme
Baissière
Portefeuille Trading
+319.20 % vs +67.75 % pour le CAC 40
Performance depuis le 28 mai 2008