


chiffres clés
Ouverture :
9.440 €
Perf Ouverture :
+0.21 %
+ Haut :
9.460 €
+ Bas :
9.400 €
Clôture veille :
9.400 €
Volume :
5 452
Capi échangé :
+0.01 %
Capi :
599 M€
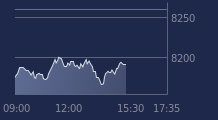
Graphique OENEO sur 5 jours
Cours OENEO sur 5 jours
| 07/04 | 08/04 | 09/04 | 10/04 | 13/04 | Date |
|---|---|---|---|---|---|
| 9.400(c) | 9.380(c) | 9.400(c) | 9.400(c) | 9.460 | Dernier |
| 0.00 % | -0.21 % | +0.21 % | 0.00 % | +0.64 % | Var. |
| 44 709 | 5 273 | 1 360 | 2 222 | 5 452 | Volume |
| 9.400 | 9.420 | 9.420 | 9.420 | 9.440 | Ouv. |
| 9.420 | 9.420 | 9.420 | 9.420 | 9.460 | + Haut |
| 9.180 | 9.380 | 9.400 | 9.400 | 9.400 | + Bas |
| 9.294 | 9.301 | 9.309 | 9.317 | 9.328 | MM20 |
| 9.236 | 9.241 | 9.246 | 9.250 | 9.255 | MM50 |
| 9.196 | 9.197 | 9.199 | 9.201 | 9.203 | MM100 |
Performances historiques OENEO
| 5 jours | 1 mois | 1er janvier | 5 ans |
|---|---|---|---|
| +0.64 % | +2.38 % | +2.16 % | -13.84 % |
Court terme
Haussière
Moyen terme
Haussière
Long terme
Haussière
Pas de conseil sur cette valeur
Portefeuille Trading
+332.70 % vs +64.79 % pour le CAC 40
Performance depuis le 28 mai 2008