


chiffres clés
Ouverture :
35.100 €
Perf Ouverture :
-0.28 %
+ Haut :
35.150 €
+ Bas :
34.550 €
Clôture veille :
35.150 €
Volume :
3 174
Capi échangé :
+0.01 %
Capi :
852 M€
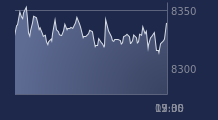
Graphique NEURONES sur 5 jours
Cours NEURONES sur 5 jours
| 06/07 | 07/07 | 08/07 | 09/07 | 10/07 | Date |
|---|---|---|---|---|---|
| 35.300(c) | 36.150(c) | 34.850(c) | 35.150(c) | 35.000(c) | Dernier |
| +0.86 % | +2.41 % | -3.60 % | +0.86 % | -0.43 % | Var. |
| 5 727 | 8 404 | 4 605 | 4 364 | 3 174 | Volume |
| 35.050 | 35.850 | 36.050 | 34.900 | 35.100 | Ouv. |
| 35.450 | 36.700 | 36.050 | 35.250 | 35.150 | + Haut |
| 34.900 | 35.850 | 34.850 | 34.300 | 34.550 | + Bas |
| 35.060 | 35.008 | 34.980 | 34.980 | 34.965 | MM20 |
| 36.704 | 36.715 | 36.699 | 36.683 | 36.664 | MM50 |
| 36.036 | 36.043 | 36.033 | 36.040 | 36.045 | MM100 |
Performances historiques NEURONES
| 5 jours | 1 mois | 1er janvier | 5 ans |
|---|---|---|---|
| 0.00 % | -5.91 % | -18.70 % | +18.64 % |
Court terme
Neutre
Moyen terme
Baissière
Long terme
Neutre
Portefeuille Trading
+319.20 % vs +67.75 % pour le CAC 40
Performance depuis le 28 mai 2008