


chiffres clés
Ouverture :
34.360 €
Perf Ouverture :
+1.48 %
+ Haut :
35.070 €
+ Bas :
34.350 €
Clôture veille :
34.250 €
Volume :
1 005 280
Capi échangé :
+0.15 %
Capi :
23 977 M€
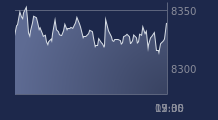
Graphique MICHELIN sur 5 jours
Cours MICHELIN sur 5 jours
| 06/07 | 07/07 | 08/07 | 09/07 | 10/07 | Date |
|---|---|---|---|---|---|
| 35.110(c) | 35.050(c) | 34.220(c) | 34.250(c) | 34.870(c) | Dernier |
| +0.77 % | -0.17 % | -2.37 % | +0.09 % | +1.81 % | Var. |
| 1 175 770 | 1 310 950 | 1 936 410 | 1 469 300 | 1 005 280 | Volume |
| 34.810 | 35.300 | 34.690 | 34.430 | 34.360 | Ouv. |
| 35.330 | 35.720 | 34.770 | 34.530 | 35.070 | + Haut |
| 34.740 | 35.050 | 34.090 | 33.930 | 34.350 | + Bas |
| 33.523 | 33.670 | 33.759 | 33.859 | 33.946 | MM20 |
| 32.281 | 32.341 | 32.396 | 32.458 | 32.539 | MM50 |
| 31.773 | 31.784 | 31.781 | 31.783 | 31.791 | MM100 |
Performances historiques MICHELIN
| 5 jours | 1 mois | 1er janvier | 5 ans |
|---|---|---|---|
| +0.09 % | +8.60 % | +23.17 % | +1.74 % |
Court terme
Haussière
Moyen terme
Haussière
Long terme
Haussière
Portefeuille Trading
+319.20 % vs +67.75 % pour le CAC 40
Performance depuis le 28 mai 2008