


chiffres clés
Ouverture :
12.240 €
Perf Ouverture :
-1.14 %
+ Haut :
12.300 €
+ Bas :
12.040 €
Clôture veille :
12.220 €
Volume :
76 227
Capi échangé :
+0.06 %
Capi :
1 530 M€
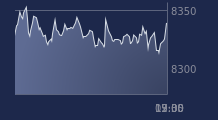
Graphique METROPOLE TV sur 5 jours
Cours METROPOLE TV sur 5 jours
| 06/07 | 07/07 | 08/07 | 09/07 | 10/07 | Date |
|---|---|---|---|---|---|
| 12.440(c) | 12.380(c) | 12.140(c) | 12.220(c) | 12.100(c) | Dernier |
| -0.48 % | -0.48 % | -1.94 % | +0.66 % | -0.98 % | Var. |
| 137 092 | 92 113 | 84 044 | 59 177 | 76 227 | Volume |
| 12.360 | 12.460 | 12.320 | 12.140 | 12.240 | Ouv. |
| 12.640 | 12.520 | 12.360 | 12.240 | 12.300 | + Haut |
| 12.360 | 12.220 | 12.060 | 12.100 | 12.040 | + Bas |
| 12.346 | 12.331 | 12.302 | 12.284 | 12.267 | MM20 |
| 11.966 | 11.960 | 11.946 | 11.934 | 11.916 | MM50 |
| 11.854 | 11.858 | 11.864 | 11.874 | 11.880 | MM100 |
Performances historiques METROPOLE TV
| 5 jours | 1 mois | 1er janvier | 5 ans |
|---|---|---|---|
| -3.20 % | -4.57 % | -0.66 % | -31.09 % |
Court terme
Neutre
Moyen terme
Baissière
Long terme
Neutre
Portefeuille Trading
+319.20 % vs +67.75 % pour le CAC 40
Performance depuis le 28 mai 2008