


chiffres clés
Ouverture :
34.800 €
Perf Ouverture :
+1.03 %
+ Haut :
35.220 €
+ Bas :
34.800 €
Clôture veille :
34.880 €
Volume :
111 131
Capi échangé :
+0.26 %
Capi :
1 519 M€
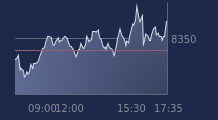
Graphique IPSOS sur 5 jours
Cours IPSOS sur 5 jours
| 07/07 | 08/07 | 09/07 | 10/07 | 13/07 | Date |
|---|---|---|---|---|---|
| 34.380(c) | 33.620(c) | 33.780(c) | 34.880(c) | 35.160(c) | Dernier |
| +0.23 % | -2.21 % | +0.48 % | +3.26 % | +0.80 % | Var. |
| 57 369 | 48 492 | 44 301 | 54 588 | 111 131 | Volume |
| 34.460 | 34.320 | 33.520 | 33.980 | 34.800 | Ouv. |
| 34.780 | 34.360 | 34.100 | 35.000 | 35.220 | + Haut |
| 34.140 | 33.460 | 33.520 | 33.980 | 34.800 | + Bas |
| 36.344 | 36.086 | 35.860 | 35.673 | 35.497 | MM20 |
| 36.871 | 36.844 | 36.810 | 36.788 | 36.755 | MM50 |
| 35.571 | 35.597 | 35.638 | 35.687 | 35.737 | MM100 |
Performances historiques IPSOS
| 5 jours | 1 mois | 1er janvier | 5 ans |
|---|---|---|---|
| +2.51 % | -8.96 % | +2.63 % | -3.67 % |
Court terme
Baissière
Moyen terme
Baissière
Long terme
Neutre
Portefeuille Trading
+320.20 % vs +68.27 % pour le CAC 40
Performance depuis le 28 mai 2008