


chiffres clés
Ouverture :
18.220 €
Perf Ouverture :
+2.31 %
+ Haut :
18.840 €
+ Bas :
18.220 €
Clôture veille :
18.290 €
Volume :
88 507
Capi échangé :
+0.12 %
Capi :
1 421 M€
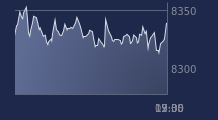
Graphique ICADE sur 5 jours
Cours ICADE sur 5 jours
| 06/07 | 07/07 | 08/07 | 09/07 | 10/07 | Date |
|---|---|---|---|---|---|
| 18.990(c) | 18.770(c) | 18.200(c) | 18.290(c) | 18.640(c) | Dernier |
| -1.25 % | -1.16 % | -3.04 % | +0.49 % | +1.91 % | Var. |
| 112 585 | 90 781 | 231 727 | 98 467 | 88 507 | Volume |
| 19.340 | 19.000 | 18.540 | 18.300 | 18.220 | Ouv. |
| 19.340 | 19.180 | 18.540 | 18.300 | 18.840 | + Haut |
| 18.950 | 18.770 | 18.100 | 18.090 | 18.220 | + Bas |
| 20.043 | 19.939 | 19.798 | 19.652 | 19.517 | MM20 |
| 20.234 | 20.201 | 20.157 | 20.120 | 20.084 | MM50 |
| 20.262 | 20.239 | 20.214 | 20.188 | 20.156 | MM100 |
Performances historiques ICADE
| 5 jours | 1 mois | 1er janvier | 5 ans |
|---|---|---|---|
| -3.07 % | -10.64 % | -15.27 % | -75.43 % |
Court terme
Baissière
Moyen terme
Baissière
Long terme
Baissière
Portefeuille Trading
+319.20 % vs +67.75 % pour le CAC 40
Performance depuis le 28 mai 2008