


chiffres clés
Ouverture :
46.600 €
Perf Ouverture :
+0.21 %
+ Haut :
46.910 €
+ Bas :
46.380 €
Clôture veille :
46.700 €
Volume :
576 180
Capi échangé :
+0.15 %
Capi :
18 122 M€
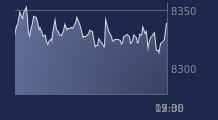
Graphique BOUYGUES sur 5 jours
Cours BOUYGUES sur 5 jours
| 06/07 | 07/07 | 08/07 | 09/07 | 10/07 | Date |
|---|---|---|---|---|---|
| 47.920(c) | 46.950(c) | 46.160(c) | 46.700(c) | 46.700(c) | Dernier |
| -0.85 % | -2.02 % | -1.68 % | +1.17 % | 0.00 % | Var. |
| 635 011 | 915 872 | 998 746 | 646 426 | 576 180 | Volume |
| 48.100 | 47.840 | 46.520 | 46.400 | 46.600 | Ouv. |
| 48.140 | 48.410 | 46.610 | 46.700 | 46.910 | + Haut |
| 47.670 | 46.800 | 45.700 | 46.190 | 46.380 | + Bas |
| 49.406 | 49.325 | 49.189 | 49.060 | 48.880 | MM20 |
| 49.937 | 49.843 | 49.771 | 49.713 | 49.641 | MM50 |
| 50.326 | 50.299 | 50.270 | 50.234 | 50.202 | MM100 |
Performances historiques BOUYGUES
| 5 jours | 1 mois | 1er janvier | 5 ans |
|---|---|---|---|
| -3.37 % | -3.85 % | +5.30 % | +47.04 % |
Court terme
Baissière
Moyen terme
Baissière
Long terme
Baissière
Portefeuille Trading
+319.20 % vs +67.75 % pour le CAC 40
Performance depuis le 28 mai 2008