


chiffres clés
Ouverture :
15.650 €
Perf Ouverture :
+0.13 %
+ Haut :
15.865 €
+ Bas :
15.620 €
Clôture veille :
15.630 €
Volume :
1 237 200
Capi échangé :
+0.27 %
Capi :
7 249 M€
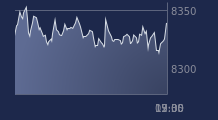
Graphique ALSTOM sur 5 jours
Cours ALSTOM sur 5 jours
| 06/07 | 07/07 | 08/07 | 09/07 | 10/07 | Date |
|---|---|---|---|---|---|
| 16.160(c) | 15.825(c) | 15.550(c) | 15.630(c) | 15.670(c) | Dernier |
| +0.94 % | -2.07 % | -1.74 % | +0.51 % | +0.26 % | Var. |
| 1 669 500 | 1 470 820 | 1 514 640 | 1 196 950 | 1 237 200 | Volume |
| 16.180 | 16.200 | 15.850 | 15.850 | 15.650 | Ouv. |
| 16.870 | 16.350 | 15.870 | 15.900 | 15.865 | + Haut |
| 16.015 | 15.825 | 15.395 | 15.500 | 15.620 | + Bas |
| 15.879 | 15.850 | 15.822 | 15.816 | 15.790 | MM20 |
| 16.576 | 16.567 | 16.548 | 16.533 | 16.505 | MM50 |
| 20.490 | 20.356 | 20.225 | 20.091 | 19.954 | MM100 |
Performances historiques ALSTOM
| 5 jours | 1 mois | 1er janvier | 5 ans |
|---|---|---|---|
| -2.12 % | -4.48 % | -37.74 % | -58.58 % |
Court terme
Neutre
Moyen terme
Baissière
Long terme
Baissière
Portefeuille Trading
+319.20 % vs +67.75 % pour le CAC 40
Performance depuis le 28 mai 2008