


chiffres clés
Ouverture :
223.500 €
Perf Ouverture :
+0.22 %
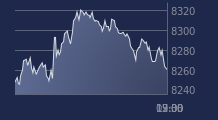
+ Haut :
225.000 €
+ Bas :
219.500 €
Clôture veille :
223.000 €
Volume :
1 935
Capi échangé :
+0.04 %
Capi :
1 008 M€
Graphique TOTAL GABON sur 5 jours
Cours TOTAL GABON sur 5 jours
| 07/04 | 08/04 | 09/04 | 10/04 | 13/04 | Date |
|---|---|---|---|---|---|
| 226.500(c) | 221.000(c) | 223.000(c) | 224.000(c) | - | Dernier |
| +2.03 % | -2.43 % | +0.90 % | +0.45 % | - | Var. |
| 1 440 | 2 383 | 3 005 | 1 935 | - | Volume |
| 225.000 | 216.000 | 218.000 | 223.500 | - | Ouv. |
| 229.500 | 222.000 | 226.500 | 225.000 | - | + Haut |
| 224.000 | 212.000 | 218.000 | 219.500 | - | + Bas |
| 221.225 | 221.525 | 222.575 | 223.275 | - | MM20 |
| 204.030 | 204.690 | 205.430 | 206.130 | - | MM50 |
| 195.025 | 195.380 | 195.740 | 196.135 | - | MM100 |
Performances historiques TOTAL GABON
| 5 jours | 1 mois | 1er janvier | 5 ans |
|---|---|---|---|
| +0.90 % | +4.19 % | +20.11 % | +60.57 % |
Court terme
Haussière
Moyen terme
Haussière
Long terme
Haussière
Portefeuille Trading
+332.70 % vs +66.15 % pour le CAC 40
Performance depuis le 28 mai 2008