


chiffres clés
Ouverture :
117.000 €
Perf Ouverture :
-1.54 %
+ Haut :
117.000 €
+ Bas :
115.200 €
Clôture veille :
116.800 €
Volume :
5 144
Capi échangé :
+0.04 %
Capi :
1 480 M€
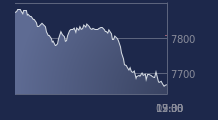
Graphique STEF sur 5 jours
Cours STEF sur 5 jours
| 16/03 | 17/03 | 18/03 | 19/03 | 20/03 | Date |
|---|---|---|---|---|---|
| 115.400(c) | 116.200(c) | 116.600(c) | 116.800(c) | 115.200(c) | Dernier |
| -1.37 % | +0.69 % | +0.34 % | +0.17 % | -1.37 % | Var. |
| 5 019 | 5 155 | 5 320 | 2 212 | 5 144 | Volume |
| 117.000 | 115.600 | 116.600 | 116.600 | 117.000 | Ouv. |
| 117.000 | 117.200 | 117.800 | 117.400 | 117.000 | + Haut |
| 115.000 | 115.400 | 116.200 | 115.800 | 115.200 | + Bas |
| 122.230 | 121.760 | 121.290 | 120.850 | 120.280 | MM20 |
| 124.432 | 124.180 | 123.936 | 123.720 | 123.468 | MM50 |
| 123.594 | 123.514 | 123.440 | 123.378 | 123.304 | MM100 |
Performances historiques STEF
| 5 jours | 1 mois | 1er janvier | 5 ans |
|---|---|---|---|
| -1.54 % | -8.28 % | -12.33 % | +34.89 % |
Court terme
Baissière
Moyen terme
Baissière
Long terme
Baissière
Portefeuille Trading
+336.60 % vs +54.20 % pour le CAC 40
Performance depuis le 28 mai 2008