chiffres clés
Ouverture :
1.642 €
Perf Ouverture :
-0.85 %
+ Haut :
1.669 €
+ Bas :
1.613 €
Clôture veille :
1.646 €
Volume :
305 894
Capi échangé :
+0.29 %
Capi :
174 M€
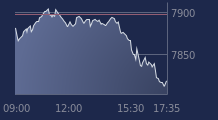
Graphique SOLUTIONS 30 SE sur 5 jours
Cours SOLUTIONS 30 SE sur 5 jours
| 11/09 | 12/09 | 15/09 | 16/09 | 17/09 | Date |
|---|---|---|---|---|---|
| 1.638(c) | 1.650(c) | 1.646(c) | 1.628(c) | - | Dernier |
| -0.43 % | +0.73 % | -0.24 % | -1.09 % | - | Var. |
| 337 741 | 265 501 | 515 244 | 305 894 | - | Volume |
| 1.638 | 1.648 | 1.675 | 1.642 | - | Ouv. |
| 1.675 | 1.675 | 1.749 | 1.669 | - | + Haut |
| 1.600 | 1.612 | 1.646 | 1.613 | - | + Bas |
| 1.698 | 1.691 | 1.683 | 1.672 | - | MM20 |
| 1.763 | 1.760 | 1.757 | 1.752 | - | MM50 |
| 1.679 | 1.679 | 1.679 | 1.679 | - | MM100 |
Performances historiques SOLUTIONS 30 SE
| 5 jours | 1 mois | 1er janvier | 5 ans |
|---|---|---|---|
| +2.71 % | -8.95 % | +77.92 % | -89.81 % |
Court terme
Neutre
Moyen terme
Baissière
Long terme
Baissière
Portefeuille Trading
+336.70 % vs +57.27 % pour le CAC 40
Performance depuis le 28 mai 2008


