


chiffres clés
Ouverture :
8.250 €
Perf Ouverture :
+9.09 %
+ Haut :
9.250 €
+ Bas :
8.180 €
Clôture veille :
8.050 €
Volume :
662 699
Capi échangé :
+3.12 %
Capi :
191 M€
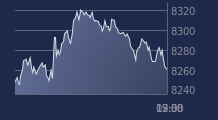
Graphique RIBER sur 5 jours
Cours RIBER sur 5 jours
| 02/04 | 07/04 | 08/04 | 09/04 | 10/04 | Date |
|---|---|---|---|---|---|
| 5.500(c) | 5.570(c) | 7.130(c) | 8.050(c) | 9.000(c) | Dernier |
| -0.18 % | +1.27 % | +28.01 % | +12.90 % | +11.80 % | Var. |
| 30 603 | 104 217 | 826 651 | 1 030 660 | 662 699 | Volume |
| 5.400 | 5.500 | 5.900 | 7.090 | 8.250 | Ouv. |
| 5.550 | 5.750 | 7.130 | 8.500 | 9.250 | + Haut |
| 5.300 | 5.430 | 5.900 | 6.810 | 8.180 | + Bas |
| 5.708 | 5.697 | 5.776 | 5.882 | 6.039 | MM20 |
| 5.656 | 5.659 | 5.684 | 5.728 | 5.790 | MM50 |
| 4.561 | 4.585 | 4.624 | 4.673 | 4.732 | MM100 |
Performances historiques RIBER
| 5 jours | 1 mois | 1er janvier | 5 ans |
|---|---|---|---|
| +63.64 % | +61.87 % | +157.14 % | +432.54 % |
Court terme
Haussière
Moyen terme
Haussière
Long terme
Haussière
Pas de conseil sur cette valeur
Portefeuille Trading
+332.70 % vs +66.15 % pour le CAC 40
Performance depuis le 28 mai 2008