


chiffres clés
Ouverture :
64.000 €
Perf Ouverture :
+2.34 %
+ Haut :
66.000 €
+ Bas :
63.900 €
Clôture veille :
64.200 €
Volume :
3 392
Capi échangé :
+0.01 %
Capi :
1 632 M€
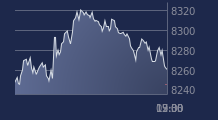
Graphique Peugeot Invest sur 5 jours
Cours Peugeot Invest sur 5 jours
| 02/04 | 07/04 | 08/04 | 09/04 | 10/04 | Date |
|---|---|---|---|---|---|
| 63.700(c) | 63.200(c) | 65.400(c) | 64.200(c) | 65.500(c) | Dernier |
| +0.31 % | -0.78 % | +3.48 % | -1.83 % | +2.02 % | Var. |
| 3 509 | 5 838 | 9 362 | 4 872 | 3 392 | Volume |
| 63.300 | 64.400 | 64.800 | 64.600 | 64.000 | Ouv. |
| 64.400 | 64.500 | 66.600 | 65.100 | 66.000 | + Haut |
| 62.800 | 62.500 | 64.800 | 63.600 | 63.900 | + Bas |
| 63.120 | 62.905 | 62.880 | 62.755 | 62.760 | MM20 |
| 68.234 | 67.994 | 67.832 | 67.646 | 67.486 | MM50 |
| 71.523 | 71.439 | 71.366 | 71.277 | 71.209 | MM100 |
Performances historiques Peugeot Invest
| 5 jours | 1 mois | 1er janvier | 5 ans |
|---|---|---|---|
| +2.83 % | -0.61 % | -13.59 % | -40.02 % |
Court terme
Haussière
Moyen terme
Neutre
Long terme
Baissière
Portefeuille Trading
+332.70 % vs +66.15 % pour le CAC 40
Performance depuis le 28 mai 2008