


chiffres clés
Ouverture :
9.850 €
Perf Ouverture :
+0.91 %
+ Haut :
10.060 €
+ Bas :
9.800 €
Clôture veille :
9.790 €
Volume :
6 788
Capi échangé :
+0.11 %
Capi :
62 M€
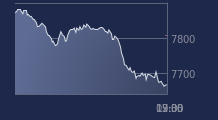
Graphique MGI DIGITAL TECHNOLOGY sur 5 jours
Cours MGI DIGITAL TECHNOLOGY sur 5 jours
| 16/03 | 17/03 | 18/03 | 19/03 | 20/03 | Date |
|---|---|---|---|---|---|
| 9.040(c) | 9.200(c) | 9.920(c) | 9.790(c) | 9.940(c) | Dernier |
| -0.99 % | +1.77 % | +7.83 % | -1.31 % | +1.53 % | Var. |
| 6 866 | 11 520 | 15 697 | 21 035 | 6 788 | Volume |
| 9.120 | 9.040 | 9.200 | 10.160 | 9.850 | Ouv. |
| 9.150 | 9.440 | 9.990 | 10.260 | 10.060 | + Haut |
| 8.940 | 9.020 | 8.980 | 9.680 | 9.800 | + Bas |
| 9.554 | 9.604 | 9.688 | 9.707 | 9.708 | MM20 |
| 9.354 | 9.352 | 9.363 | 9.368 | 9.377 | MM50 |
| 9.460 | 9.448 | 9.445 | 9.439 | 9.437 | MM100 |
Performances historiques MGI DIGITAL TECHNOLOGY
| 5 jours | 1 mois | 1er janvier | 5 ans |
|---|---|---|---|
| +8.87 % | +5.52 % | +6.08 % | -79.92 % |
Court terme
Haussière
Moyen terme
Haussière
Long terme
Neutre
Pas de conseil sur cette valeur
Portefeuille Trading
+336.60 % vs +54.20 % pour le CAC 40
Performance depuis le 28 mai 2008