


chiffres clés
Ouverture :
123.7600 €
+ Haut :
123.8100 €
+ Bas :
123.7200 €
Perf Ouverture :
-0.03 %
Clôture veille :
123.8000 €
Volume :
100
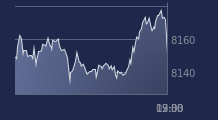
Graphique LYXOR HIGH YLD BB sur 5 jours
Cours LYXOR HIGH YLD BB sur 5 jours
| 15/12 | 16/12 | 17/12 | 18/12 | 19/12 | Date |
|---|---|---|---|---|---|
| 123.6400(c) | 123.5400(c) | 123.4300(c) | 123.8000(c) | 123.7200(c) | Dernier |
| +0.15 % | -0.08 % | -0.09 % | +0.30 % | -0.06 % | Var. |
| 123.3900 | 123.3800 | 123.5000 | 123.5800 | 123.7600 | Ouv. |
| 123.6400 | 123.5400 | 123.6300 | 123.8000 | 123.8100 | + Haut |
| 123.3400 | 123.2500 | 123.4300 | 123.5800 | 123.7200 | + Bas |
| 127.0820 | 126.8630 | 126.6370 | 126.4230 | 126.2260 | MM20 |
| 127.6500 | 127.5680 | 127.4830 | 127.4130 | 127.3500 | MM50 |
| 127.5180 | 127.4830 | 127.4490 | 127.4170 | 127.3870 | MM100 |
Produit
Trackers
Type de produit
-
Sous-jacent
Type de sous-jacent
-
Emetteur
-
Portefeuille Trading
+335.20 % vs +63.98 % pour le CAC 40
Performance depuis le 28 mai 2008