


chiffres clés
Ouverture :
70.6900 €
+ Haut :
71.4000 €
+ Bas :
70.4500 €
Perf Ouverture :
+0.69 %
Clôture veille :
70.7900 €
Volume :
8 567
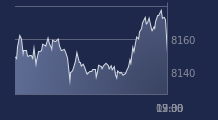
Graphique LYXOR ETF SX50 DL sur 5 jours
Cours LYXOR ETF SX50 DL sur 5 jours
| 15/12 | 16/12 | 17/12 | 18/12 | 19/12 | Date |
|---|---|---|---|---|---|
| 71.0900(c) | 70.1700(c) | 69.2500(c) | 70.7900(c) | 71.1800(c) | Dernier |
| +1.24 % | -1.29 % | -1.31 % | +2.22 % | +0.55 % | Var. |
| 70.8600 | 70.5000 | 70.6000 | 69.2100 | 70.6900 | Ouv. |
| 71.2200 | 71.0300 | 70.8300 | 70.7900 | 71.4000 | + Haut |
| 70.6600 | 69.9600 | 69.2000 | 69.1600 | 70.4500 | + Bas |
| 68.7035 | 68.9250 | 69.0945 | 69.3060 | 69.5980 | MM20 |
| 68.7306 | 68.7770 | 68.7870 | 68.8412 | 68.9500 | MM50 |
| 65.9284 | 66.0037 | 66.0662 | 66.1604 | 66.2951 | MM100 |
Produit
Trackers
Type de produit
Leveraged
Sous-jacent
DOW JONES EURO S…
Type de sous-jacent
-
Emetteur
LYXOR ASSET MANAGEMENT
Portefeuille Trading
+335.20 % vs +63.98 % pour le CAC 40
Performance depuis le 28 mai 2008