


chiffres clés
Ouverture :
108.0200 €
+ Haut :
108.0400 €
+ Bas :
108.0200 €
Perf Ouverture :
+0.02 %
Clôture veille :
108.0400 €
Volume :
23 389
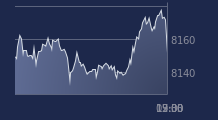
Graphique LYXOR ETF SMART C sur 5 jours
Cours LYXOR ETF SMART C sur 5 jours
| 15/12 | 16/12 | 17/12 | 18/12 | 19/12 | Date |
|---|---|---|---|---|---|
| 107.9800(c) | 107.9800(c) | 108.0200(c) | 108.0400(c) | 108.0400(c) | Dernier |
| -0.02 % | 0.00 % | +0.04 % | +0.02 % | 0.00 % | Var. |
| 108.0000 | 107.9800 | 107.9800 | 108.0000 | 108.0200 | Ouv. |
| 108.0000 | 108.0000 | 108.0200 | 108.0400 | 108.0400 | + Haut |
| 107.9800 | 107.9800 | 107.9800 | 108.0000 | 108.0200 | + Bas |
| 107.9080 | 107.9160 | 107.9260 | 107.9360 | 107.9460 | MM20 |
| 107.7590 | 107.7680 | 107.7780 | 107.7880 | 107.7990 | MM50 |
| 107.5170 | 107.5260 | 107.5360 | 107.5460 | 107.5560 | MM100 |
Produit
Trackers
Type de produit
-
Sous-jacent
Type de sous-jacent
-
Emetteur
-
Portefeuille Trading
+335.20 % vs +63.98 % pour le CAC 40
Performance depuis le 28 mai 2008