


chiffres clés
Ouverture :
371.5200 €
+ Haut :
373.9100 €
+ Bas :
371.0400 €
Perf Ouverture :
+0.64 %
Clôture veille :
371.9600 €
Volume :
4 509
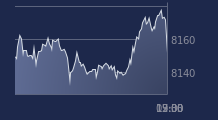
Graphique LYXOR ETF MSCI WOR sur 5 jours
Cours LYXOR ETF MSCI WOR sur 5 jours
| 15/12 | 16/12 | 17/12 | 18/12 | 19/12 | Date |
|---|---|---|---|---|---|
| 371.7100(c) | 369.1200(c) | 367.7900(c) | 371.9600(c) | 373.9100(c) | Dernier |
| +0.09 % | -0.70 % | -0.36 % | +1.13 % | +0.52 % | Var. |
| 373.3300 | 369.7400 | 371.5300 | 367.8300 | 371.5200 | Ouv. |
| 374.2200 | 370.9200 | 372.3400 | 372.0400 | 373.9100 | + Haut |
| 371.0000 | 368.7100 | 367.7900 | 367.8300 | 371.0400 | + Bas |
| 375.4320 | 375.4300 | 375.3100 | 375.2630 | 375.5420 | MM20 |
| 375.6330 | 375.5800 | 375.4300 | 375.3630 | 375.4780 | MM50 |
| 367.6470 | 367.7810 | 367.8860 | 368.0230 | 368.2860 | MM100 |
Produit
Trackers
Type de produit
Regions
Sous-jacent
MSCI WORLD
Type de sous-jacent
-
Emetteur
LYXOR ASSET MANAGEMENT
Portefeuille Trading
+335.20 % vs +63.98 % pour le CAC 40
Performance depuis le 28 mai 2008