


chiffres clés
Ouverture :
89.8540 €
+ Haut :
90.0730 €
+ Bas :
89.7180 €
Perf Ouverture :
+0.20 %
Clôture veille :
91.0730 €
Volume :
238
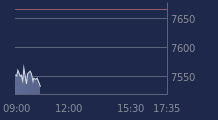
Graphique LYXOR ETF DJ GT50 sur 5 jours
Cours LYXOR ETF DJ GT50 sur 5 jours
| 17/03 | 18/03 | 19/03 | 20/03 | 23/03 | Date |
|---|---|---|---|---|---|
| 94.2010(c) | 93.5740(c) | 92.0940(c) | 91.0730(c) | 90.0330 | Dernier |
| -0.12 % | -0.67 % | -1.58 % | -1.11 % | -1.14 % | Var. |
| 94.1060 | 94.7530 | 93.1310 | 92.1280 | 89.8540 | Ouv. |
| 94.6290 | 94.8620 | 93.1310 | 92.1380 | 90.0730 | + Haut |
| 94.1060 | 93.5740 | 91.9790 | 91.0730 | 89.7180 | + Bas |
| 94.3625 | 94.3458 | 94.2689 | 94.0913 | 93.9018 | MM20 |
| 94.6661 | 94.6130 | 94.5375 | 94.4241 | 94.2880 | MM50 |
| 94.7347 | 94.7350 | 94.7073 | 94.6604 | 94.6068 | MM100 |
Produit
Trackers
Type de produit
Lyxor ETF DJ Global Titans 50
Sous-jacent
DJ GLOBAL TITANS…
Type de sous-jacent
-
Emetteur
LYXOR AM
Portefeuille Trading
+336.60 % vs +51.58 % pour le CAC 40
Performance depuis le 28 mai 2008