


chiffres clés
Ouverture :
17.3990 €
+ Haut :
17.4800 €
+ Bas :
17.3990 €
Perf Ouverture :
+0.47 %
Clôture veille :
17.4020 €
Volume :
604
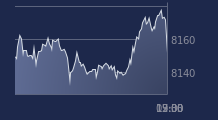
Graphique LYXOR ETF BTP DDS sur 5 jours
Cours LYXOR ETF BTP DDS sur 5 jours
| 15/12 | 16/12 | 17/12 | 18/12 | 19/12 | Date |
|---|---|---|---|---|---|
| 17.4750(c) | 17.4680(c) | 17.3550(c) | 17.4020(c) | 17.4800(c) | Dernier |
| -0.07 % | -0.04 % | -0.65 % | +0.27 % | +0.45 % | Var. |
| 17.4750 | 17.4680 | 17.3550 | 17.4020 | 17.3990 | Ouv. |
| 17.4750 | 17.4680 | 17.3550 | 17.4020 | 17.4800 | + Haut |
| 17.4750 | 17.4680 | 17.3550 | 17.4020 | 17.3990 | + Bas |
| 17.3273 | 17.3384 | 17.3432 | 17.3505 | 17.3612 | MM20 |
| 17.2327 | 17.2298 | 17.2277 | 17.2268 | 17.2280 | MM50 |
| 17.3769 | 17.3763 | 17.3745 | 17.3737 | 17.3741 | MM100 |
Produit
Trackers
Type de produit
Leveraged Short
Sous-jacent
SGI DAILY DOUBLE…
Type de sous-jacent
-
Emetteur
LYXOR ASSET MANAGEMENT
Portefeuille Trading
+335.20 % vs +63.98 % pour le CAC 40
Performance depuis le 28 mai 2008