


chiffres clés
Ouverture :
0.196 €
Perf Ouverture :
-2.05 %
+ Haut :
0.196 €
+ Bas :
0.192 €
Clôture veille :
0.196 €
Volume :
22 685
Capi échangé :
+0.03 %
Capi :
17 M€
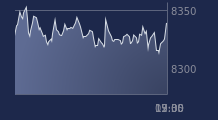
Graphique VERIMATRIX sur 5 jours
Cours VERIMATRIX sur 5 jours
| 06/07 | 07/07 | 08/07 | 09/07 | 10/07 | Date |
|---|---|---|---|---|---|
| 0.207(c) | 0.205(c) | 0.197(c) | 0.196(c) | 0.192(c) | Dernier |
| +4.55 % | -0.97 % | -3.90 % | -0.76 % | -2.05 % | Var. |
| 20 360 | 14 291 | 35 335 | 59 487 | 22 685 | Volume |
| 0.199 | 0.207 | 0.203 | 0.196 | 0.196 | Ouv. |
| 0.210 | 0.209 | 0.203 | 0.196 | 0.196 | + Haut |
| 0.198 | 0.200 | 0.196 | 0.192 | 0.192 | + Bas |
| 0.213 | 0.211 | 0.209 | 0.208 | 0.206 | MM20 |
| 0.207 | 0.208 | 0.208 | 0.209 | 0.209 | MM50 |
| 0.191 | 0.191 | 0.191 | 0.191 | 0.191 | MM100 |
Performances historiques VERIMATRIX
| 5 jours | 1 mois | 1er janvier | 5 ans |
|---|---|---|---|
| -3.28 % | -18.16 % | -6.13 % | -90.33 % |
Court terme
Baissière
Moyen terme
Neutre
Long terme
Neutre
Pas de conseil sur cette valeur
Portefeuille Trading
+319.20 % vs +67.75 % pour le CAC 40
Performance depuis le 28 mai 2008