


chiffres clés
Ouverture :
56.000 €
Perf Ouverture :
+0.71 %
+ Haut :
56.400 €
+ Bas :
55.800 €
Clôture veille :
55.800 €
Volume :
942
Capi échangé :
+0.01 %
Capi :
635 M€
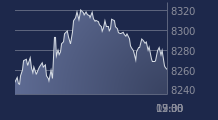
Graphique GROUPE CRIT sur 5 jours
Cours GROUPE CRIT sur 5 jours
| 02/04 | 07/04 | 08/04 | 09/04 | 10/04 | Date |
|---|---|---|---|---|---|
| 57.800(c) | 57.600(c) | 57.600(c) | 55.800(c) | 56.400(c) | Dernier |
| +1.05 % | -0.35 % | 0.00 % | -3.13 % | +1.08 % | Var. |
| 675 | 1 166 | 494 | 890 | 942 | Volume |
| 57.400 | 61.200 | 58.000 | 57.600 | 56.000 | Ouv. |
| 57.800 | 61.200 | 58.600 | 57.600 | 56.400 | + Haut |
| 57.400 | 57.600 | 57.600 | 55.800 | 55.800 | + Bas |
| 59.220 | 59.170 | 59.140 | 59.040 | 58.950 | MM20 |
| 60.912 | 60.884 | 60.856 | 60.780 | 60.704 | MM50 |
| 60.198 | 60.180 | 60.160 | 60.118 | 60.078 | MM100 |
Performances historiques GROUPE CRIT
| 5 jours | 1 mois | 1er janvier | 5 ans |
|---|---|---|---|
| -2.42 % | -3.09 % | -3.09 % | -17.30 % |
Court terme
Baissière
Moyen terme
Baissière
Long terme
Baissière
Pas de conseil sur cette valeur
Portefeuille Trading
+332.70 % vs +66.15 % pour le CAC 40
Performance depuis le 28 mai 2008