


Ouverture :
-
Perf Ouverture :
-
+ Haut :
-
+ Bas :
-
Clôture veille :
122.500 €
Volume :
-
Capi échangé :
0.00 %
Capi :
13 210 M€
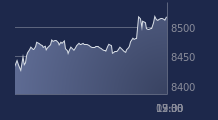
Graphique EURONEXT sur 5 jours
Cours EURONEXT sur 5 jours
| 17/02 | 18/02 | 19/02 | 20/02 | 23/02 | Date |
|---|---|---|---|---|---|
| 126.500(c) | 126.500(c) | 122.500(c) | 127.400(c) | - | Dernier |
| +0.88 % | 0.00 % | -3.16 % | +4.00 % | - | Var. |
| 213 853 | 288 773 | 427 368 | 332 862 | - | Volume |
| 125.900 | 125.900 | 122.400 | 122.700 | - | Ouv. |
| 127.600 | 127.200 | 124.500 | 127.700 | - | + Haut |
| 125.600 | 124.600 | 120.000 | 122.700 | - | + Bas |
| 120.020 | 120.275 | 120.320 | 120.625 | - | MM20 |
| 122.892 | 122.900 | 122.808 | 122.796 | - | MM50 |
| 124.934 | 124.932 | 124.889 | 124.889 | - | MM100 |
Performances historiques EURONEXT
| 5 jours | 1 mois | 1er janvier | 5 ans |
|---|---|---|---|
| +2.25 % | +4.08 % | -0.47 % | +38.55 % |
Court terme
Haussière
Moyen terme
Neutre
Long terme
Neutre
Portefeuille Trading
+335.80 % vs +71.30 % pour le CAC 40
Performance depuis le 28 mai 2008