


chiffres clés
Ouverture :
39.100 €
Perf Ouverture :
+1.02 %
+ Haut :
40.400 €
+ Bas :
39.100 €
Clôture veille :
38.800 €
Volume :
9 928
Capi échangé :
+0.07 %
Capi :
599 M€
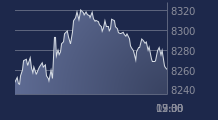
Graphique EQUASENS (ex-PHARMAGEST) sur 5 jours
Cours EQUASENS (ex-PHARMAGEST) sur 5 jours
| 02/04 | 07/04 | 08/04 | 09/04 | 10/04 | Date |
|---|---|---|---|---|---|
| 38.000(c) | 39.200(c) | 39.650(c) | 38.800(c) | 39.500(c) | Dernier |
| -2.31 % | +3.16 % | +1.15 % | -2.14 % | +1.80 % | Var. |
| 9 371 | 12 266 | 10 111 | 8 191 | 9 928 | Volume |
| 38.700 | 38.400 | 40.300 | 39.600 | 39.100 | Ouv. |
| 38.700 | 39.500 | 40.600 | 39.600 | 40.400 | + Haut |
| 37.900 | 38.400 | 39.650 | 38.800 | 39.100 | + Bas |
| 36.028 | 36.155 | 36.253 | 36.350 | 36.515 | MM20 |
| 36.688 | 36.658 | 36.646 | 36.617 | 36.607 | MM50 |
| 39.660 | 39.642 | 39.619 | 39.590 | 39.568 | MM100 |
Performances historiques EQUASENS (ex-PHARMAGEST)
| 5 jours | 1 mois | 1er janvier | 5 ans |
|---|---|---|---|
| +3.95 % | +4.77 % | -12.22 % | -59.49 % |
Court terme
Haussière
Moyen terme
Neutre
Long terme
Baissière
Portefeuille Trading
+332.70 % vs +66.15 % pour le CAC 40
Performance depuis le 28 mai 2008