


chiffres clés
Ouverture :
17.900 €
Perf Ouverture :
+1.70 %
+ Haut :
18.420 €
+ Bas :
17.825 €
Clôture veille :
18.095 €
Volume :
918 167
Capi échangé :
+0.39 %
Capi :
4 314 M€
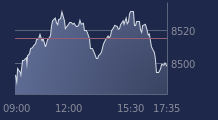
Graphique EDENRED sur 5 jours
Cours EDENRED sur 5 jours
| 18/02 | 19/02 | 20/02 | 23/02 | 24/02 | Date |
|---|---|---|---|---|---|
| 17.760(c) | 17.810(c) | 18.095(c) | 18.205(c) | - | Dernier |
| -1.20 % | +0.28 % | +1.60 % | +0.61 % | - | Var. |
| 910 712 | 623 990 | 844 707 | 918 167 | - | Volume |
| 17.920 | 17.745 | 17.810 | 17.900 | - | Ouv. |
| 18.005 | 18.150 | 18.420 | 18.420 | - | + Haut |
| 17.365 | 17.625 | 17.615 | 17.825 | - | + Bas |
| 17.693 | 17.672 | 17.707 | 17.746 | - | MM20 |
| 18.131 | 18.130 | 18.133 | 18.135 | - | MM50 |
| 19.620 | 19.597 | 19.576 | 19.554 | - | MM100 |
Performances historiques EDENRED
| 5 jours | 1 mois | 1er janvier | 5 ans |
|---|---|---|---|
| +3.26 % | -0.14 % | -3.73 % | -61.64 % |
Court terme
Haussière
Moyen terme
Haussière
Long terme
Neutre
Portefeuille Trading
+335.50 % vs +70.93 % pour le CAC 40
Performance depuis le 28 mai 2008