


chiffres clés
Ouverture :
9.630 €
Perf Ouverture :
-1.14 %
+ Haut :
9.630 €
+ Bas :
9.520 €
Clôture veille :
9.640 €
Volume :
3 720
Capi échangé :
+0.01 %
Capi :
237 M€
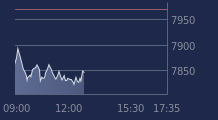
Graphique COMPAGNIE CHARGEURS INVEST sur 5 jours
Cours COMPAGNIE CHARGEURS INVEST sur 5 jours
| 13/03 | 16/03 | 17/03 | 18/03 | 19/03 | Date |
|---|---|---|---|---|---|
| 9.550(c) | 9.560(c) | 9.650(c) | 9.640(c) | 9.520 | Dernier |
| -2.55 % | +0.10 % | +0.94 % | -0.10 % | -1.24 % | Var. |
| 6 709 | 3 301 | 1 376 | 3 080 | 3 720 | Volume |
| 9.850 | 9.660 | 9.560 | 9.650 | 9.630 | Ouv. |
| 9.850 | 9.660 | 9.650 | 9.730 | 9.630 | + Haut |
| 9.550 | 9.560 | 9.550 | 9.620 | 9.520 | + Bas |
| 9.867 | 9.845 | 9.829 | 9.813 | 9.791 | MM20 |
| 10.101 | 10.089 | 10.077 | 10.063 | 10.045 | MM50 |
| 10.020 | 10.015 | 10.011 | 10.006 | 10.000 | MM100 |
Performances historiques COMPAGNIE CHARGEURS INVEST
| 5 jours | 1 mois | 1er janvier | 5 ans |
|---|---|---|---|
| -2.86 % | -4.42 % | -4.70 % | -56.73 % |
Court terme
Baissière
Moyen terme
Baissière
Long terme
Baissière
Pas de conseil sur cette valeur
Portefeuille Trading
+336.50 % vs +57.70 % pour le CAC 40
Performance depuis le 28 mai 2008