Ouverture :
5.220 €
Perf Ouverture :
0.00 %
+ Haut :
5.220 €
+ Bas :
5.100 €
Clôture veille :
5.200 €
Volume :
8 776
Capi échangé :
+0.02 %
Capi :
269 M€
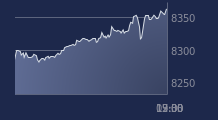
Graphique BOURSE DIRECT sur 5 jours
Cours BOURSE DIRECT sur 5 jours
| 06/01 | 07/01 | 08/01 | 09/01 | 09/01 | Date |
|---|---|---|---|---|---|
| 5.28 | 5.3 | 5.2 | 5.22 | 5.22 | Dernier |
| +8.87 % | +0.38 % | -1.89 % | +0.38 % | +0.38 % | Var. |
| 69977 | 31979 | 11206 | 8776 | 8776 | Volume |
| 4.85 | 5.38 | 5.18 | 5.22 | 5.22 | Ouv. |
| 5.32 | 5.46 | 5.24 | 5.22 | 5.22 | + Haut |
| 4.83 | 5.14 | 5.12 | 5.1 | 5.1 | + Bas |
| 4.435 | 4.482 | 4.526 | 4.569 | 4.569 | MM20 |
| 4.2808 | 4.3004 | 4.3176 | 4.3366 | 4.3366 | MM50 |
| 4.2287 | 4.2389 | 4.2482 | 4.2575 | 4.2575 | MM100 |
Performances historiques BOURSE DIRECT
| 5 jours | 1 mois | 1er janvier | 5 ans |
|---|---|---|---|
| +16.00 % | +20.83 % | +18.37 % | +80.00 % |
Court terme
Haussière
Moyen terme
Haussière
Long terme
Haussière
Portefeuille Trading
+335.10 % vs +68.21 % pour le CAC 40
Performance depuis le 28 mai 2008


