


chiffres clés
Ouverture :
0.482 €
Perf Ouverture :
+1.77 %
+ Haut :
0.490 €
+ Bas :
0.482 €
Clôture veille :
0.484 €
Volume :
47 064
Capi échangé :
+0.03 %
Capi :
76 M€
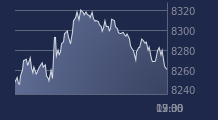
Graphique AGFA-GEVAERT sur 5 jours
Cours AGFA-GEVAERT sur 5 jours
| 07/04 | 08/04 | 09/04 | 10/04 | 13/04 | Date |
|---|---|---|---|---|---|
| 0.479(c) | 0.485(c) | 0.484(c) | 0.490(c) | - | Dernier |
| -0.73 % | +1.25 % | -0.21 % | +1.24 % | - | Var. |
| 98 920 | 71 528 | 84 383 | 47 064 | - | Volume |
| 0.483 | 0.490 | 0.484 | 0.482 | - | Ouv. |
| 0.490 | 0.490 | 0.490 | 0.490 | - | + Haut |
| 0.479 | 0.481 | 0.481 | 0.482 | - | + Bas |
| 0.471 | 0.473 | 0.474 | 0.476 | - | MM20 |
| 0.481 | 0.481 | 0.480 | 0.480 | - | MM50 |
| 0.516 | 0.512 | 0.509 | 0.506 | - | MM100 |
Performances historiques AGFA-GEVAERT
| 5 jours | 1 mois | 1er janvier | 5 ans |
|---|---|---|---|
| +1.55 % | +8.77 % | -2.78 % | -88.11 % |
Court terme
Haussière
Moyen terme
Neutre
Long terme
Baissière
Pas de conseil sur cette valeur
Portefeuille Trading
+332.70 % vs +66.15 % pour le CAC 40
Performance depuis le 28 mai 2008