


chiffres clés
Ouverture :
28.200 €
Perf Ouverture :
-0.71 %
+ Haut :
28.200 €
+ Bas :
27.900 €
Clôture veille :
28.200 €
Volume :
457
Capi échangé :
+0.00 %
Capi :
682 M€
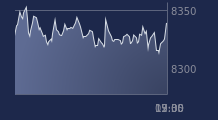
Graphique SYNERGIE sur 5 jours
Cours SYNERGIE sur 5 jours
| 06/07 | 07/07 | 08/07 | 09/07 | 10/07 | Date |
|---|---|---|---|---|---|
| 27.600(c) | 27.500(c) | 27.500(c) | 28.200(c) | 28.000(c) | Dernier |
| +0.36 % | -0.36 % | 0.00 % | +2.55 % | -0.71 % | Var. |
| 32 974 | 130 | 398 | 1 296 | 457 | Volume |
| 27.400 | 27.500 | 27.800 | 27.500 | 28.200 | Ouv. |
| 27.600 | 27.700 | 27.800 | 28.200 | 28.200 | + Haut |
| 27.000 | 27.500 | 27.500 | 27.500 | 27.900 | + Bas |
| 28.175 | 28.115 | 28.050 | 28.020 | 28.005 | MM20 |
| 28.832 | 28.812 | 28.790 | 28.784 | 28.780 | MM50 |
| 28.416 | 28.392 | 28.373 | 28.360 | 28.343 | MM100 |
Performances historiques SYNERGIE
| 5 jours | 1 mois | 1er janvier | 5 ans |
|---|---|---|---|
| +1.82 % | -2.44 % | -7.28 % | -17.16 % |
Court terme
Neutre
Moyen terme
Baissière
Long terme
Baissière
Portefeuille Trading
+319.20 % vs +67.75 % pour le CAC 40
Performance depuis le 28 mai 2008