


chiffres clés
Ouverture :
8.480 €
Perf Ouverture :
+0.59 %
+ Haut :
8.530 €
+ Bas :
8.410 €
Clôture veille :
8.310 €
Volume :
8 556
Capi échangé :
+0.03 %
Capi :
212 M€
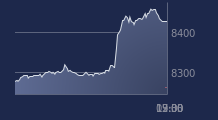
Graphique COMPAGNIE CHARGEURS INVEST sur 5 jours
Cours COMPAGNIE CHARGEURS INVEST sur 5 jours
| 13/04 | 14/04 | 15/04 | 16/04 | 17/04 | Date |
|---|---|---|---|---|---|
| 8.500(c) | 8.330(c) | 8.460(c) | 8.310(c) | 8.530(c) | Dernier |
| -1.05 % | -2.00 % | +1.56 % | -1.77 % | +2.65 % | Var. |
| 11 178 | 12 985 | 17 681 | 19 856 | 8 556 | Volume |
| 8.570 | 8.540 | 8.330 | 8.540 | 8.480 | Ouv. |
| 8.600 | 8.540 | 8.460 | 8.540 | 8.530 | + Haut |
| 8.430 | 8.260 | 8.320 | 8.300 | 8.410 | + Bas |
| 8.923 | 8.862 | 8.807 | 8.740 | 8.684 | MM20 |
| 9.560 | 9.520 | 9.485 | 9.446 | 9.413 | MM50 |
| 9.841 | 9.828 | 9.816 | 9.803 | 9.793 | MM100 |
Performances historiques COMPAGNIE CHARGEURS INVEST
| 5 jours | 1 mois | 1er janvier | 5 ans |
|---|---|---|---|
| -0.70 % | -10.77 % | -14.61 % | -63.95 % |
Court terme
Baissière
Moyen terme
Baissière
Long terme
Baissière
Pas de conseil sur cette valeur
Portefeuille Trading
+330.50 % vs +69.48 % pour le CAC 40
Performance depuis le 28 mai 2008