


chiffres clés
Ouverture :
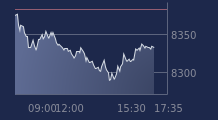
8.400 €
Perf Ouverture :
-0.48 %
+ Haut :
8.440 €
+ Bas :
8.340 €
Clôture veille :
8.370 €
Volume :
5 344
Capi échangé :
+0.02 %
Capi :
273 M€
Graphique BONDUELLE sur 5 jours
Cours BONDUELLE sur 5 jours
| 10/07 | 13/07 | 14/07 | 15/07 | 16/07 | Date |
|---|---|---|---|---|---|
| 8.060(c) | 8.140(c) | 8.340(c) | 8.370(c) | 8.360 | Dernier |
| +0.50 % | +0.99 % | +2.46 % | +0.36 % | -0.12 % | Var. |
| 20 694 | 6 873 | 18 905 | 14 349 | 5 344 | Volume |
| 8.050 | 8.090 | 8.140 | 8.310 | 8.400 | Ouv. |
| 8.140 | 8.140 | 8.340 | 8.470 | 8.440 | + Haut |
| 7.990 | 8.030 | 8.120 | 8.200 | 8.340 | + Bas |
| 7.892 | 7.897 | 7.913 | 7.929 | 7.950 | MM20 |
| 8.063 | 8.050 | 8.048 | 8.045 | 8.049 | MM50 |
| 8.405 | 8.382 | 8.362 | 8.345 | 8.327 | MM100 |
Performances historiques BONDUELLE
| 5 jours | 1 mois | 1er janvier | 5 ans |
|---|---|---|---|
| +4.24 % | +3.85 % | -20.38 % | -59.61 % |
Court terme
Haussière
Moyen terme
Neutre
Long terme
Baissière
Portefeuille Trading
+319.50 % vs +67.78 % pour le CAC 40
Performance depuis le 28 mai 2008