


chiffres clés
Ouverture :
6.220 €
Perf Ouverture :
+0.80 %
+ Haut :
6.280 €
+ Bas :
6.160 €
Clôture veille :
6.200 €
Volume :
70 688
Capi échangé :
+0.09 %
Capi :
519 M€
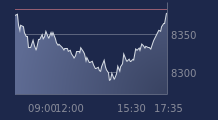
Graphique BENETEAU sur 5 jours
Cours BENETEAU sur 5 jours
| 10/07 | 13/07 | 14/07 | 15/07 | 16/07 | Date |
|---|---|---|---|---|---|
| 6.070(c) | 6.130(c) | 6.080(c) | 6.200(c) | 6.270(c) | Dernier |
| -0.49 % | +0.99 % | -0.82 % | +1.97 % | +1.13 % | Var. |
| 67 874 | 57 735 | 40 458 | 63 185 | 70 688 | Volume |
| 6.150 | 6.050 | 6.100 | 6.090 | 6.220 | Ouv. |
| 6.230 | 6.180 | 6.160 | 6.230 | 6.280 | + Haut |
| 6.070 | 6.030 | 6.040 | 6.040 | 6.160 | + Bas |
| 6.434 | 6.395 | 6.357 | 6.333 | 6.315 | MM20 |
| 6.732 | 6.720 | 6.709 | 6.695 | 6.678 | MM50 |
| 6.896 | 6.880 | 6.864 | 6.846 | 6.832 | MM100 |
Performances historiques BENETEAU
| 5 jours | 1 mois | 1er janvier | 5 ans |
|---|---|---|---|
| +2.79 % | -9.26 % | -24.50 % | -52.14 % |
Court terme
Neutre
Moyen terme
Baissière
Long terme
Baissière
Pas de conseil sur cette valeur
Portefeuille Trading
+319.50 % vs +68.53 % pour le CAC 40
Performance depuis le 28 mai 2008