


chiffres clés
Ouverture :
56.200 €
Perf Ouverture :
+0.53 %
+ Haut :
56.950 €
+ Bas :
56.000 €
Clôture veille :
56.250 €
Volume :
40 363
Capi échangé :
+0.05 %
Capi :
4 297 M€
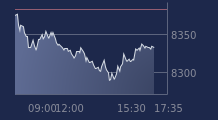
Graphique ARKEMA sur 5 jours
Cours ARKEMA sur 5 jours
| 10/07 | 13/07 | 14/07 | 15/07 | 16/07 | Date |
|---|---|---|---|---|---|
| 54.500(c) | 56.100(c) | 57.000(c) | 56.250(c) | 56.500 | Dernier |
| +1.30 % | +2.94 % | +1.60 % | -1.32 % | +0.44 % | Var. |
| 245 253 | 166 193 | 160 171 | 212 057 | 40 363 | Volume |
| 53.850 | 54.400 | 56.050 | 56.850 | 56.200 | Ouv. |
| 54.550 | 56.100 | 58.200 | 57.050 | 56.950 | + Haut |
| 53.850 | 54.100 | 55.800 | 55.100 | 56.000 | + Bas |
| 56.473 | 56.383 | 56.325 | 56.175 | 56.120 | MM20 |
| 59.240 | 59.123 | 59.011 | 58.852 | 58.736 | MM50 |
| 58.753 | 58.700 | 58.670 | 58.628 | 58.592 | MM100 |
Performances historiques ARKEMA
| 5 jours | 1 mois | 1er janvier | 5 ans |
|---|---|---|---|
| +5.02 % | -2.42 % | +8.34 % | -47.25 % |
Court terme
Neutre
Moyen terme
Baissière
Long terme
Baissière
Pas de conseil sur cette valeur
Portefeuille Trading
+319.50 % vs +67.78 % pour le CAC 40
Performance depuis le 28 mai 2008