Ouverture :
5.430 €
Perf Ouverture :
+0.74 %
+ Haut :
5.500 €
+ Bas :
5.375 €
Clôture veille :
5.370 €
Volume :
104 418
Capi échangé :
+0.08 %
Capi :
715 M€
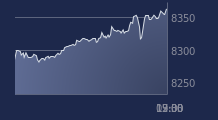
Graphique X-FAB sur 5 jours
Cours X-FAB sur 5 jours
| 06/01 | 07/01 | 08/01 | 09/01 | 09/01 | Date |
|---|---|---|---|---|---|
| 5.475 | 5.515 | 5.37 | 5.47 | 5.47 | Dernier |
| +0.37 % | +0.73 % | -2.63 % | +1.86 % | +1.86 % | Var. |
| 68764 | 143960 | 117698 | 104418 | 104418 | Volume |
| 5.425 | 5.475 | 5.5 | 5.43 | 5.43 | Ouv. |
| 5.51 | 5.58 | 5.56 | 5.5 | 5.5 | + Haut |
| 5.37 | 5.39 | 5.335 | 5.375 | 5.375 | + Bas |
| 5.18345 | 5.19295 | 5.19945 | 5.21095 | 5.21095 | MM20 |
| 5.14014 | 5.12044 | 5.09794 | 5.07994 | 5.07994 | MM50 |
| 5.95972 | 5.94192 | 5.92317 | 5.90607 | 5.90607 | MM100 |
Performances historiques X-FAB
| 5 jours | 1 mois | 1er janvier | 5 ans |
|---|---|---|---|
| +3.60 % | +4.39 % | +5.80 % | -4.87 % |
Court terme
Haussière
Moyen terme
Neutre
Long terme
Baissière
Portefeuille Trading
+335.10 % vs +68.21 % pour le CAC 40
Performance depuis le 28 mai 2008


