


Ouverture :
-
Perf Ouverture :
-
+ Haut :
-
+ Bas :
-
Clôture veille :
85.200 €
Volume :
-
Capi échangé :
-
Capi :
682 M€
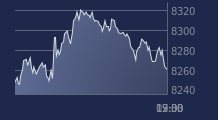
Graphique SECHE ENVIRONNEM. sur 5 jours
Cours SECHE ENVIRONNEM. sur 5 jours
| 07/04 | 08/04 | 09/04 | 10/04 | 13/04 | Date |
|---|---|---|---|---|---|
| 80.600(c) | 83.200(c) | 85.200(c) | 86.800(c) | - | Dernier |
| -1.59 % | +3.23 % | +2.40 % | +1.88 % | - | Var. |
| 9 759 | 8 937 | 6 871 | 11 033 | - | Volume |
| 81.700 | 81.200 | 83.400 | 86.000 | - | Ouv. |
| 83.100 | 84.200 | 85.500 | 89.700 | - | + Haut |
| 79.600 | 80.400 | 83.400 | 86.000 | - | + Bas |
| 76.795 | 77.635 | 78.350 | 79.035 | - | MM20 |
| 69.910 | 70.002 | 70.124 | 70.272 | - | MM50 |
| 70.556 | 70.721 | 70.916 | 71.137 | - | MM100 |
Performances historiques SECHE ENVIRONNEM.
| 5 jours | 1 mois | 1er janvier | 5 ans |
|---|---|---|---|
| +5.98 % | +30.72 % | +18.26 % | +71.88 % |
Court terme
Haussière
Moyen terme
Haussière
Long terme
Haussière
Portefeuille Trading
+332.70 % vs +66.15 % pour le CAC 40
Performance depuis le 28 mai 2008