


chiffres clés
Ouverture :
9.815 €
Perf Ouverture :
-1.88 %
+ Haut :
9.860 €
+ Bas :
9.590 €
Clôture veille :
9.700 €
Volume :
5 129 250
Capi échangé :
+0.65 %
Capi :
7 549 M€
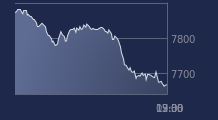
Graphique AYVENS (ex-ALD) sur 5 jours
Cours AYVENS (ex-ALD) sur 5 jours
| 17/03 | 18/03 | 19/03 | 20/03 | 23/03 | Date |
|---|---|---|---|---|---|
| 9.860(c) | 10.130(c) | 9.700(c) | 9.630(c) | - | Dernier |
| +2.23 % | +2.74 % | -4.24 % | -0.72 % | - | Var. |
| 1 641 030 | 1 130 820 | 945 411 | 5 129 250 | - | Volume |
| 9.610 | 9.980 | 9.985 | 9.815 | - | Ouv. |
| 9.890 | 10.230 | 10.040 | 9.860 | - | + Haut |
| 9.610 | 9.980 | 9.700 | 9.590 | - | + Bas |
| 10.302 | 10.260 | 10.207 | 10.138 | - | MM20 |
| 11.161 | 11.121 | 11.076 | 11.028 | - | MM50 |
| 11.094 | 11.092 | 11.086 | 11.081 | - | MM100 |
Performances historiques AYVENS (ex-ALD)
| 5 jours | 1 mois | 1er janvier | 5 ans |
|---|---|---|---|
| +0.89 % | -10.50 % | -15.82 % | -21.07 % |
Court terme
Baissière
Moyen terme
Baissière
Long terme
Baissière
Portefeuille Trading
+336.60 % vs +54.20 % pour le CAC 40
Performance depuis le 28 mai 2008