


chiffres clés
Ouverture :
24.300 €
Perf Ouverture :
-0.21 %
+ Haut :
24.650 €
+ Bas :
24.100 €
Clôture veille :
24.050 €
Volume :
29 192
Capi échangé :
+0.15 %
Capi :
482 M€
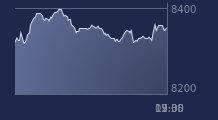
Graphique KAUFMAN ET BROAD sur 5 jours
Cours KAUFMAN ET BROAD sur 5 jours
| 08/06 | 09/06 | 10/06 | 11/06 | 12/06 | Date |
|---|---|---|---|---|---|
| 24.250(c) | 24.150(c) | 24.200(c) | 24.050(c) | 24.250(c) | Dernier |
| 0.00 % | -0.41 % | +0.21 % | -0.62 % | +0.83 % | Var. |
| 37 814 | 24 733 | 29 784 | 47 526 | 29 192 | Volume |
| 24.200 | 24.250 | 24.400 | 24.150 | 24.300 | Ouv. |
| 24.350 | 24.500 | 24.450 | 24.500 | 24.650 | + Haut |
| 24.050 | 24.100 | 24.000 | 23.950 | 24.100 | + Bas |
| 24.813 | 24.770 | 24.728 | 24.673 | 24.668 | MM20 |
| 27.034 | 26.935 | 26.843 | 26.760 | 26.679 | MM50 |
| 28.900 | 28.840 | 28.780 | 28.724 | 28.671 | MM100 |
Performances historiques KAUFMAN ET BROAD
| 5 jours | 1 mois | 1er janvier | 5 ans |
|---|---|---|---|
| 0.00 % | -5.09 % | -18.90 % | -37.09 % |
Court terme
Baissière
Moyen terme
Baissière
Long terme
Baissière
Portefeuille Trading
+325.40 % vs +67.99 % pour le CAC 40
Performance depuis le 28 mai 2008