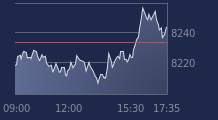
chiffres clés
Ouverture :
43.860 €
Perf Ouverture :
-1.46 %
+ Haut :
43.900 €
+ Bas :
42.680 €
Clôture veille :
43.920 €
Volume :
3 473
Capi échangé :
+0.03 %
Capi :
556 M€
Graphique ESSO sur 5 jours
Cours ESSO sur 5 jours
| 05/01 | 06/01 | 07/01 | 08/01 | 08/01 | Date |
|---|---|---|---|---|---|
| 44.62 | 44.84 | 43.92 | 43.22 | 43.22 | Dernier |
| -1.02 % | +0.49 % | -2.05 % | -1.59 % | -1.59 % | Var. |
| 8238 | 3402 | 3915 | 3473 | 3473 | Volume |
| 45.48 | 45.22 | 44.3 | 43.86 | 43.86 | Ouv. |
| 45.78 | 45.22 | 44.3 | 43.9 | 43.9 | + Haut |
| 44.24 | 44 | 43.26 | 42.68 | 42.68 | + Bas |
| 43.704 | 43.777 | 43.796 | 43.722 | 43.722 | MM20 |
| 59.5546 | 58.4754 | 57.3568 | 56.2442 | 56.2442 | MM50 |
| 78.4633 | 77.9487 | 77.4294 | 76.9086 | 76.9086 | MM100 |
Performances historiques ESSO
| 5 jours | 1 mois | 1er janvier | 5 ans |
|---|---|---|---|
| -0.60 % | -0.73 % | -0.60 % | +238.98 % |
Court terme
Neutre
Moyen terme
Baissière
Long terme
Baissière
Portefeuille Trading
+334.60 % vs +65.83 % pour le CAC 40
Performance depuis le 28 mai 2008


