


chiffres clés
Ouverture :
23.5010 €
+ Haut :
23.7600 €
+ Bas :
23.4670 €
Perf Ouverture :
-0.05 %
Clôture veille :
23.4650 €
Volume :
27 477
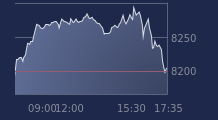
Graphique LYXOR ETF IBOVESPA sur 5 jours
Cours LYXOR ETF IBOVESPA sur 5 jours
| 04/06 | 05/06 | 08/06 | 09/06 | 10/06 | Date |
|---|---|---|---|---|---|
| 24.0880(c) | 23.8430(c) | 23.4650(c) | 23.4900(c) | - | Dernier |
| -0.02 % | -1.02 % | -1.59 % | +0.11 % | - | Var. |
| 24.0760 | 23.9100 | 23.6480 | 23.5010 | - | Ouv. |
| 24.1220 | 24.0450 | 23.8070 | 23.7600 | - | + Haut |
| 23.9160 | 23.8170 | 23.3710 | 23.4670 | - | + Bas |
| 25.2491 | 25.0994 | 24.9552 | 24.8249 | - | MM20 |
| 26.4098 | 26.3771 | 26.3243 | 26.2781 | - | MM50 |
| 25.8592 | 25.8736 | 25.8816 | 25.8861 | - | MM100 |
Produit
Trackers
Type de produit
Brésil
Sous-jacent
IBOVESPA
Type de sous-jacent
-
Emetteur
LYXOR A.M.
Portefeuille Trading
+324.00 % vs +65.02 % pour le CAC 40
Performance depuis le 28 mai 2008